 e1pi
e1piGuidesReports12 min read
The twelve reports, explained.
Every company and every auditor needs the same twelve numbers. E1pi reads them live from Tally Prime, SAP or QuickBooks the moment you ask — in one consistent layout, for one company or all of them. This guide walks through each report: what it answers, how to ask for it in plain words, and what you will see on screen.
00Before you start
There is no menu to learn. You ask for a report the way you would ask a colleague, and E1pi works out the report type, the period, the companies and the currency from your sentence. If something is ambiguous it asks one question back — it never guesses at a number.
Show me profit for the last five years, side by side.
P&L for all companies, August, in USD.
Three things are true of every report in this guide:
- Live, never cached. Each figure is read from the ERP at the moment you ask. If a bill was booked a minute ago, it is in the report now.
- Same layout, whichever software. Tally Prime, SAP, QuickBooks or a system built for you — the report reads identically, so a group with mixed software still gets one picture.
- Drillable. Tap a figure to open the ledger behind it, then the voucher, then the document that started it.
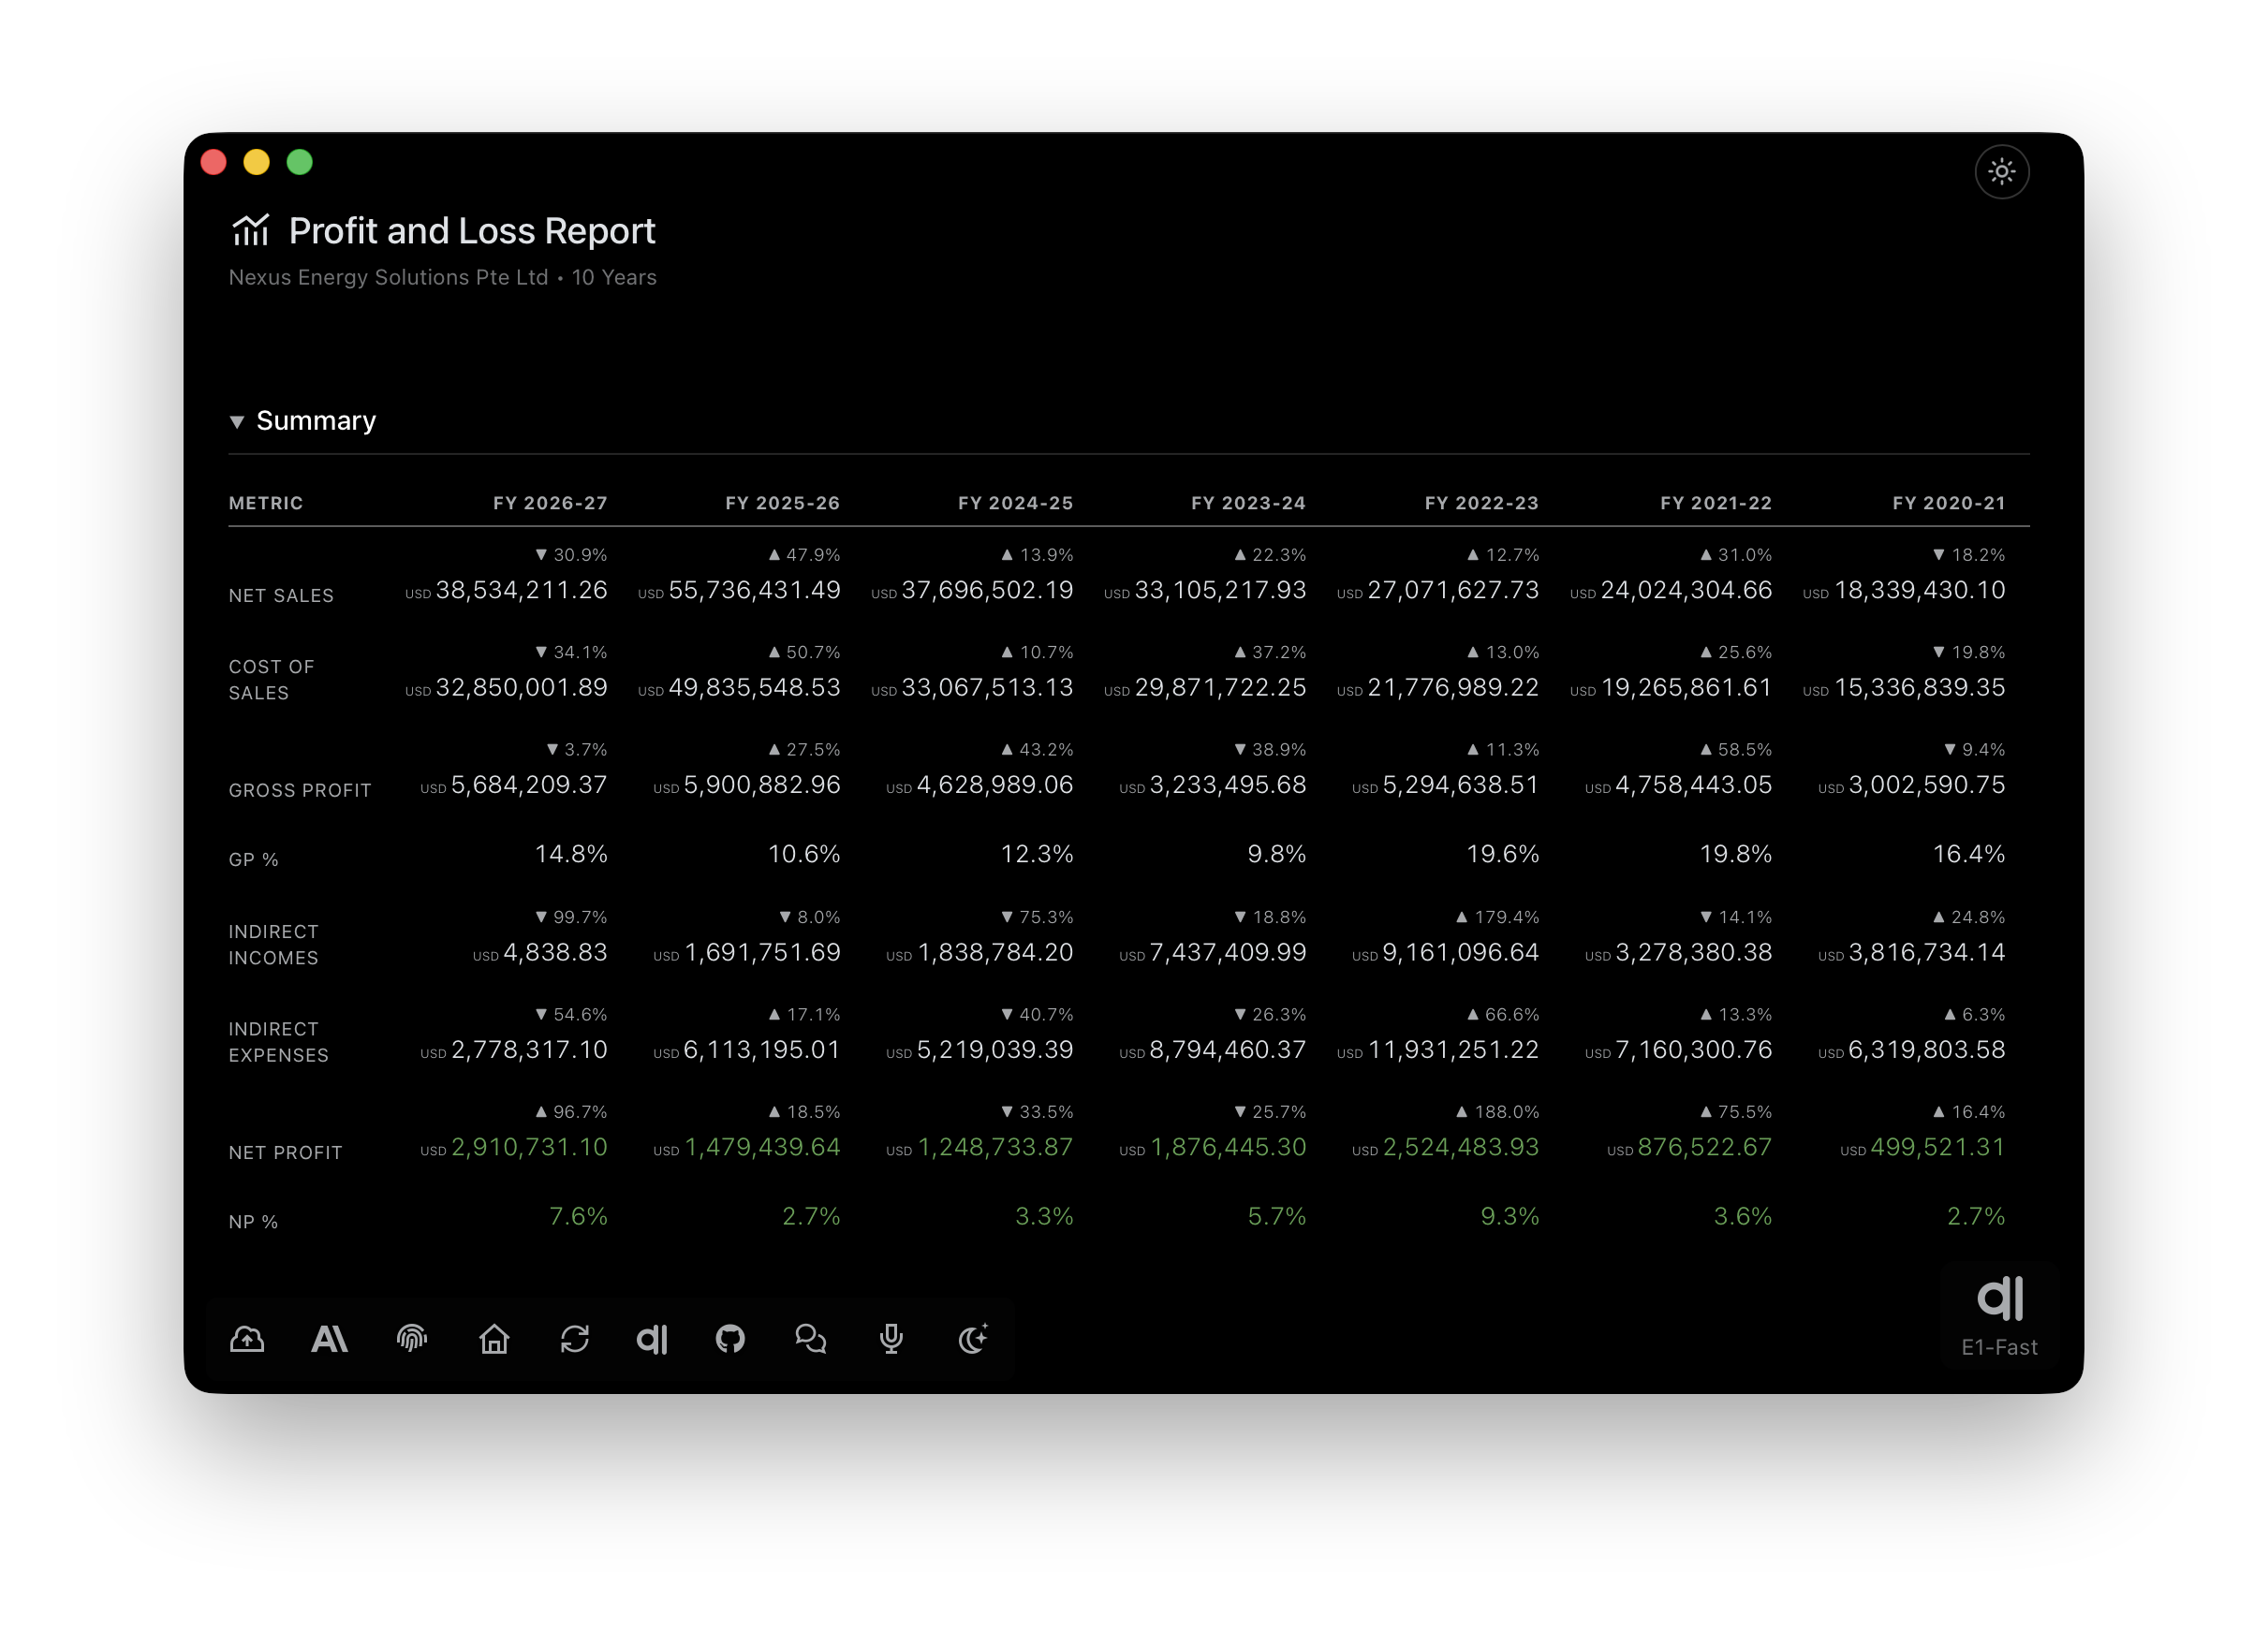
01Profit & Loss
The first question every owner asks: are we making money, and where exactly? The report opens with Net Sales and Cost of Sales, gives you Gross Profit and GP%, then indirect incomes and expenses down to Net Profit and NP%. Ask for any span — a month, twelve months across, or up to twelve financial years side by side.
P&L for the last four months.
Compare profit for FY 2024, 2025 and 2026 — all companies.
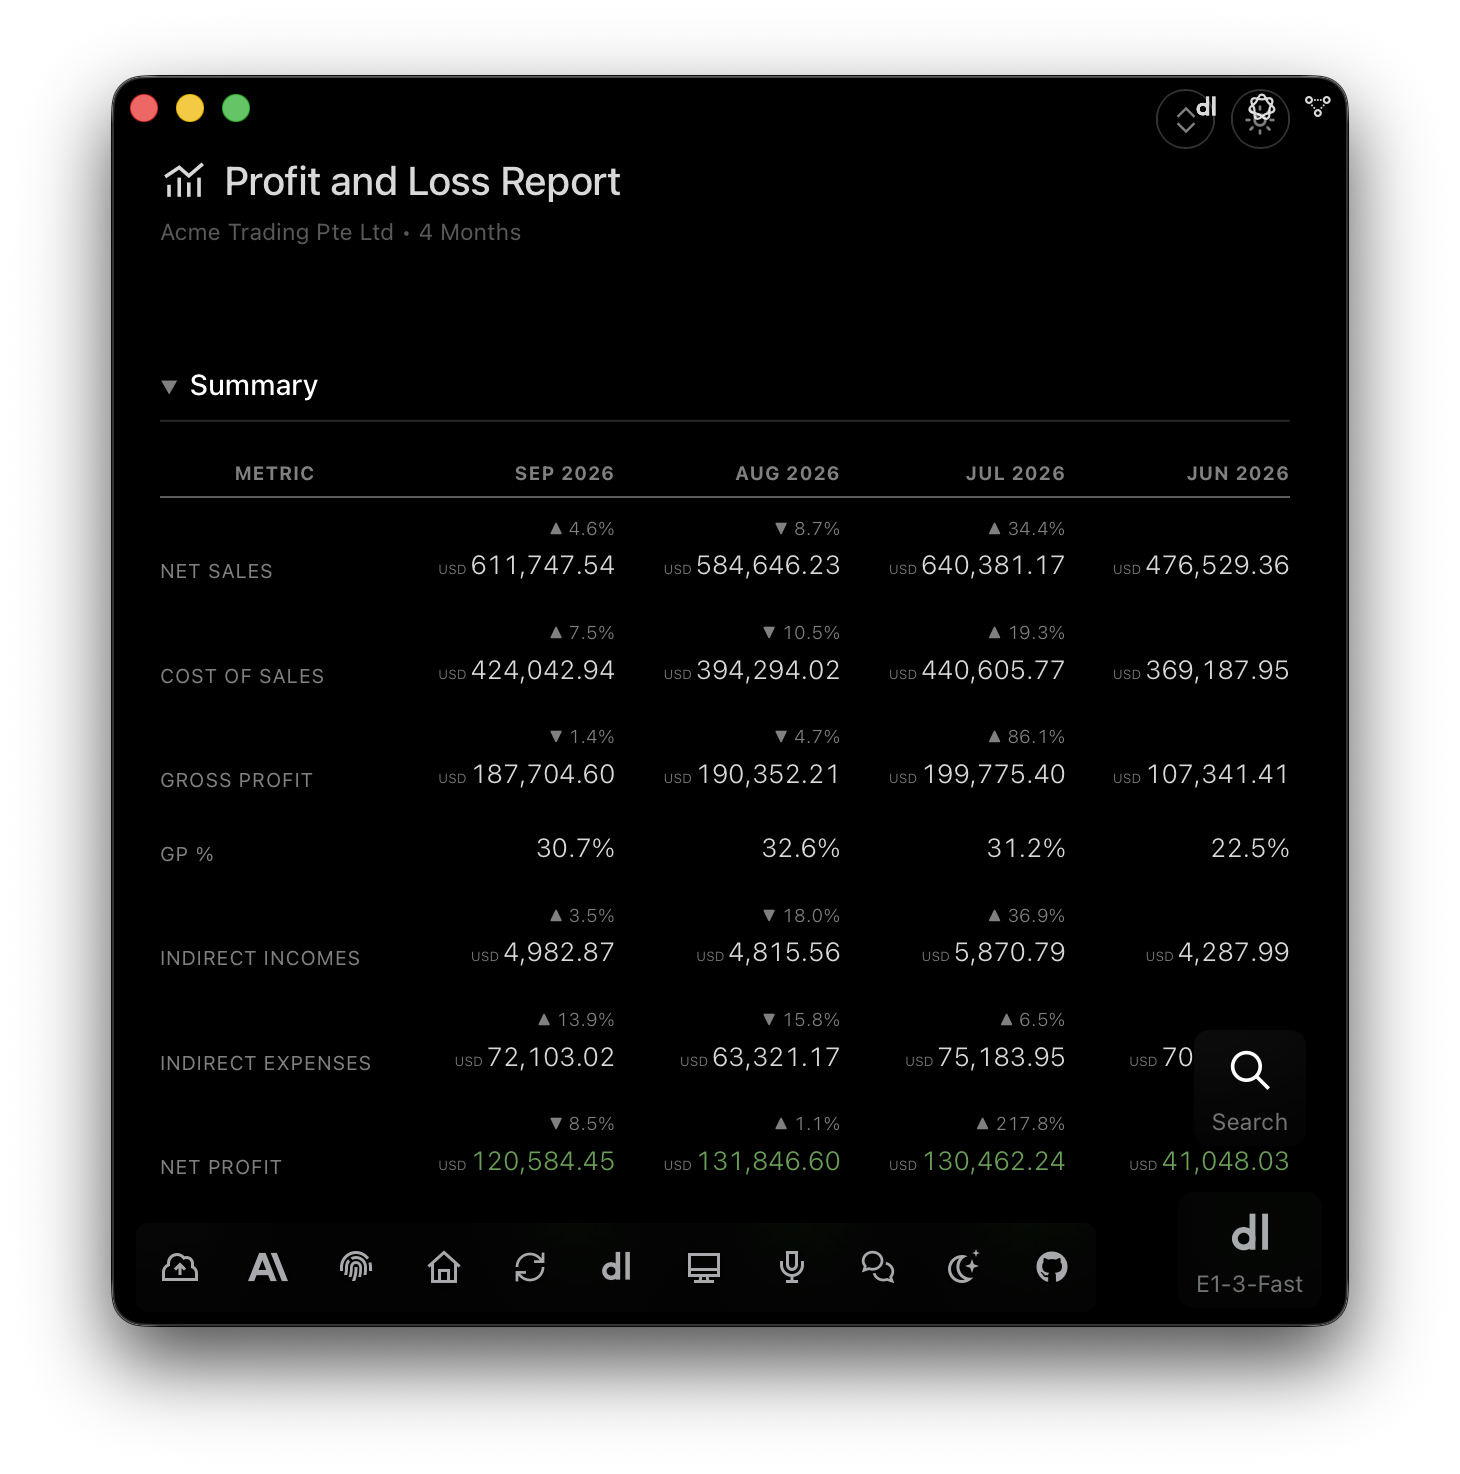
What you will see
- Movement on every line. A small arrow and percentage above each figure — up or down against the previous period.
- GP% and NP% per period. Margins are computed for each column, so a good month on sales and a bad month on margin are both visible.
- Summary first, detail on tap. The summary block is collapsed by default; open it to see each income and expense head, then each ledger.
Say in INR or in USD at the end of the sentence and every company is converted into that one currency for the comparison.
02Balance Sheet
What we own, what we owe, and what is left — as at any date. Liabilities & Capital and Assets are opened head by head: Share Capital & Reserves, Loans, Current Liabilities, Fixed Assets, Current Assets. Ask for a year-on-year or month-on-month view and the same report lays the dates side by side.
Balance sheet as at today.
Balance sheet, 31 March for the last three years.
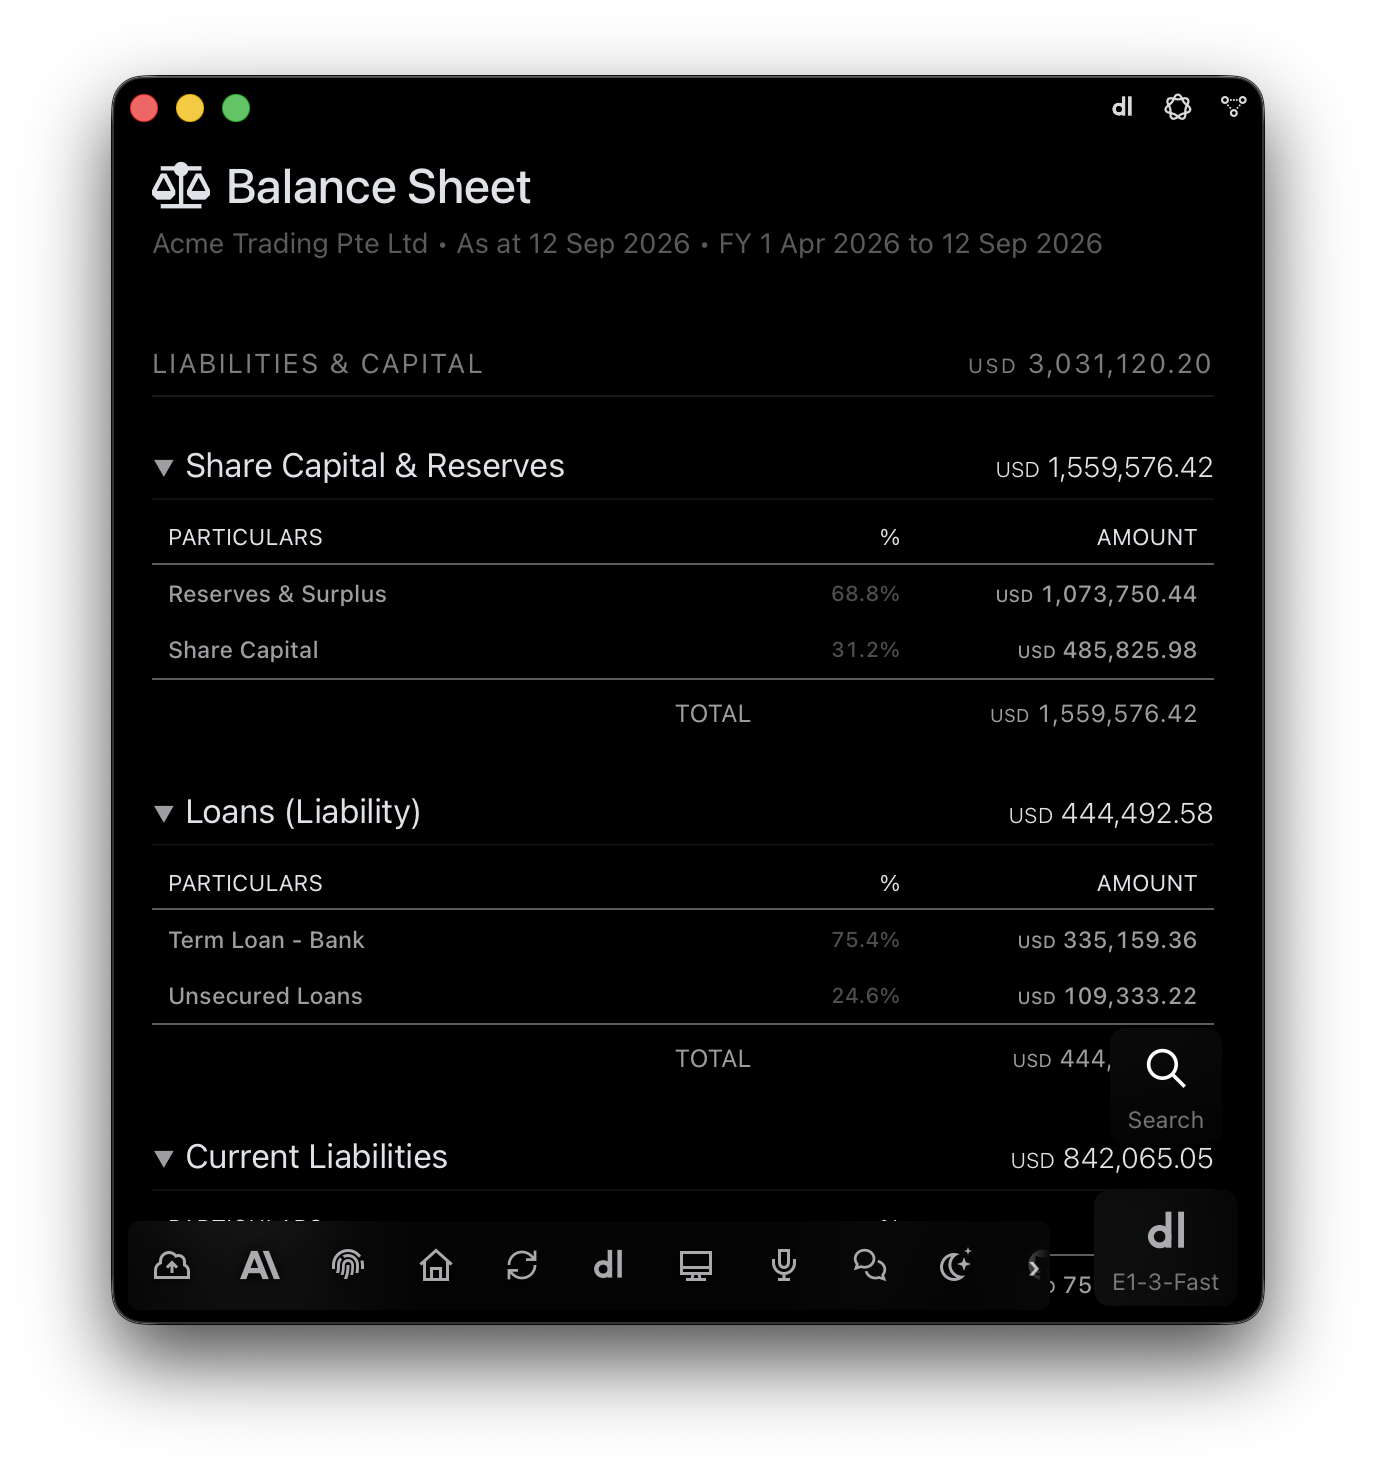
What you will see
- As at any date. Today, a quarter end, the last day of a financial year — the report is built for the date you name.
- YoY and MoM comparison. Up to ten periods across, each column a full balance sheet for that date.
- Always balanced. If the books do not tie, the report says so rather than hiding the difference.
03Trial Balance
The report your auditor opens first. Every ledger under its account group — opening, debit, credit, closing — with Dr and Cr aligned and the group total on the header. It is the fastest way to find a ledger that has drifted, a suspense balance nobody cleared, or a debit sitting where a credit should be.
Trial balance for this financial year, ledger-wise.
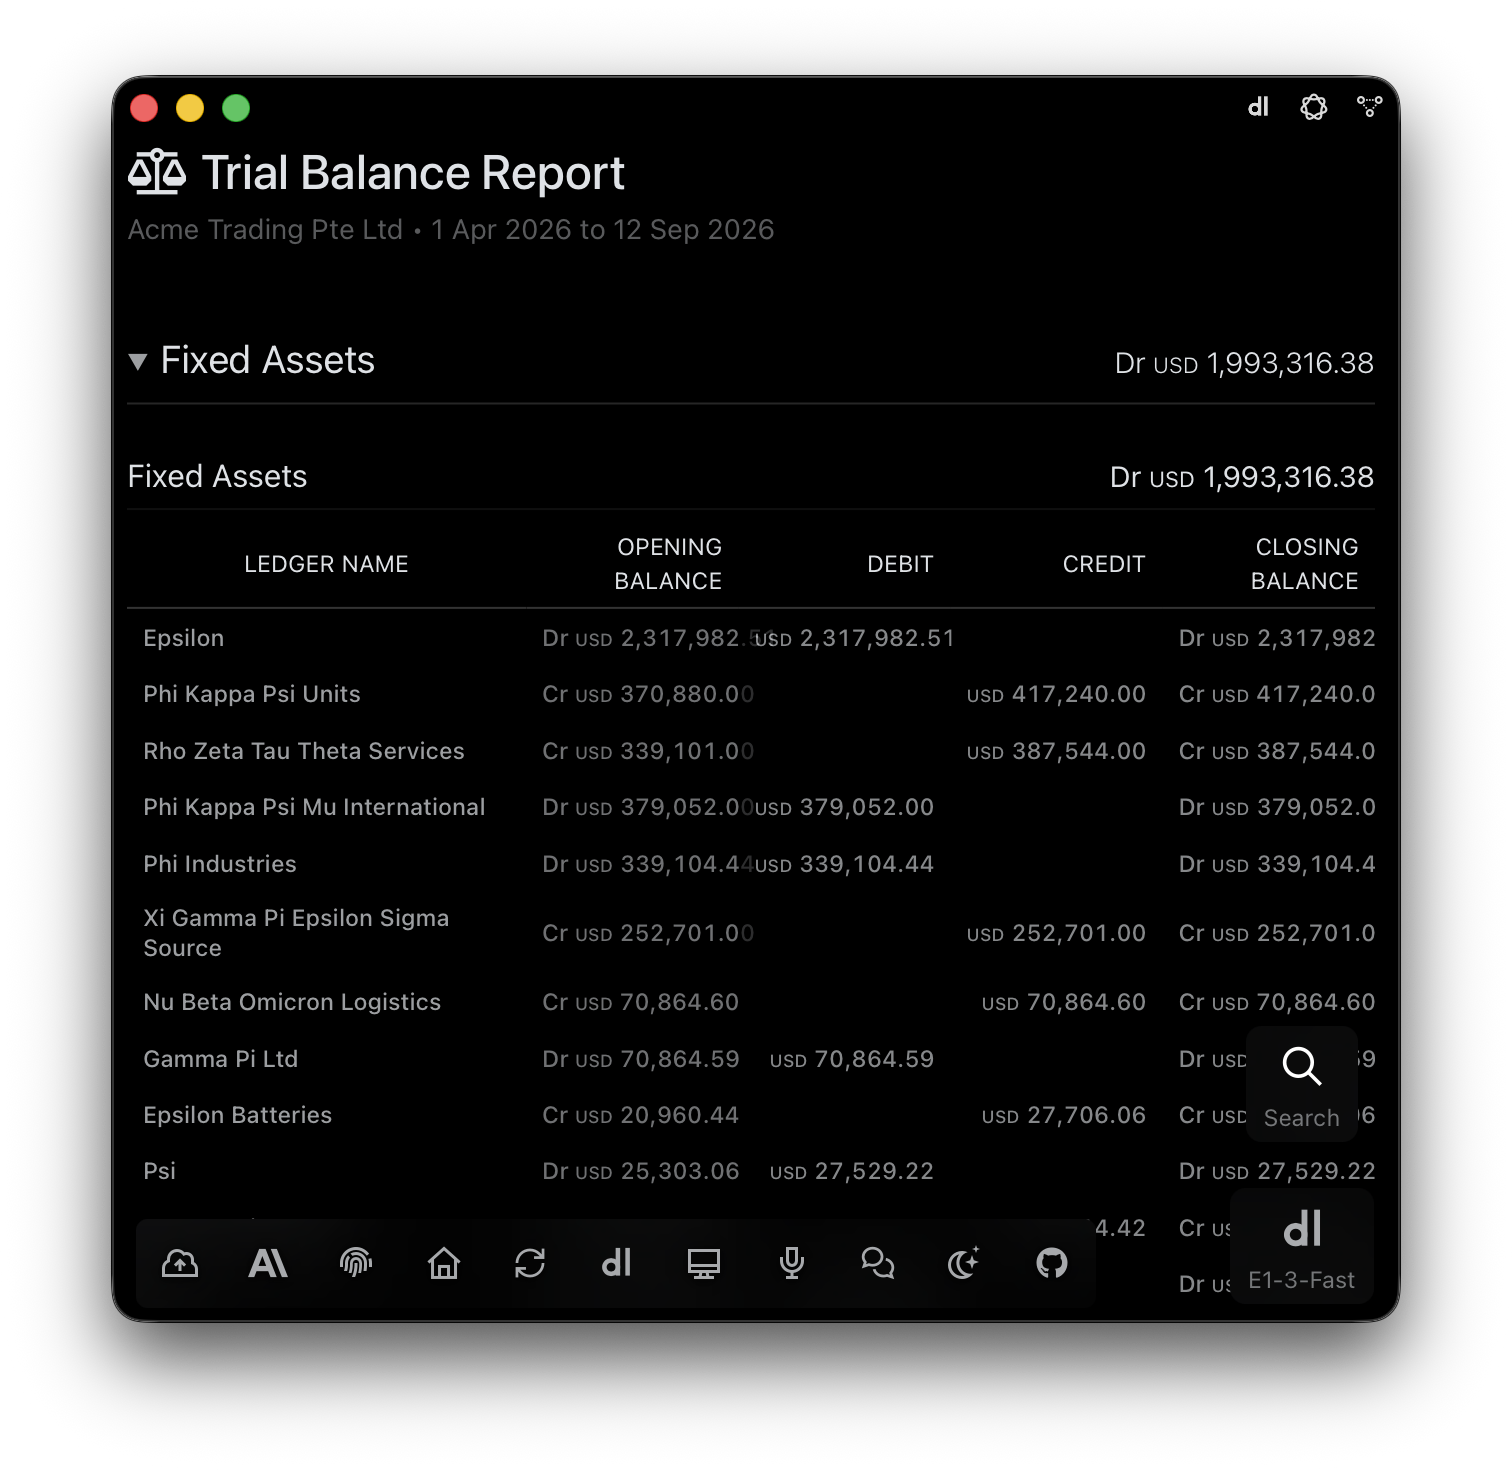
What you will see
- Account type, then parent group, then ledger. Each level opens the same way; the total on every header.
- Search any ledger. Type part of a name and the report filters as you type.
- Drill to the voucher. Tap a ledger to open every voucher behind its closing balance for the period.
04Day Book
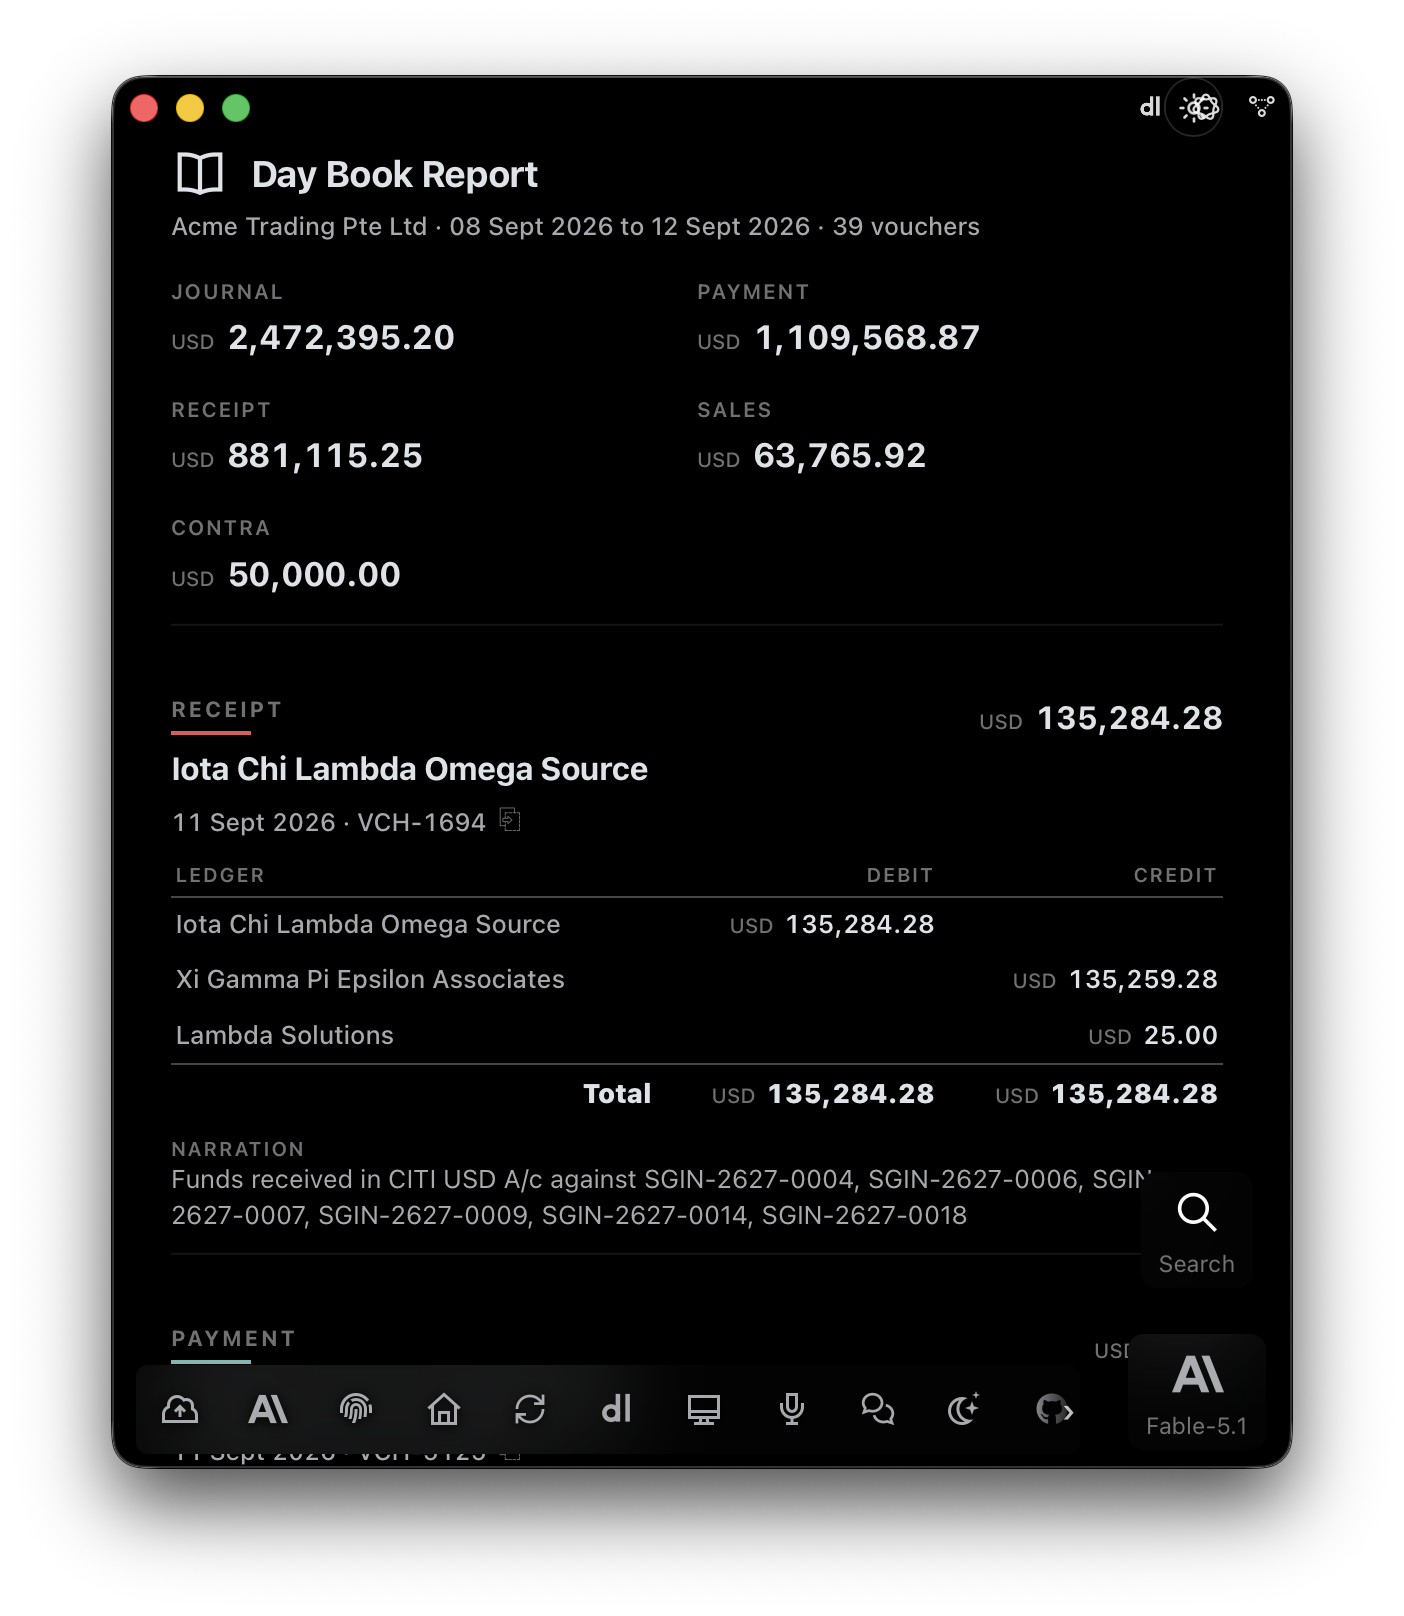
Everything that happened today, this week, or in any range you name — totalled by voucher type first (journal, payment, receipt, sales, purchase, contra), then every voucher in full: the ledgers, the debit and credit, and the narration that explains it. It is the report that answers “did we get paid by Starlight last week?”.
Day book for last week.
All payments made in the last three days.
What you will see
- Voucher-type totals up top. How much went out, came in, or was journaled — before you read a single line.
- The source document attached. Entries E1pi made carry the bank line or bill they came from.
- Filter by party or ledger. “Vouchers for Omega Nu Beta Power this month” narrows the same report.
05Stock Summary
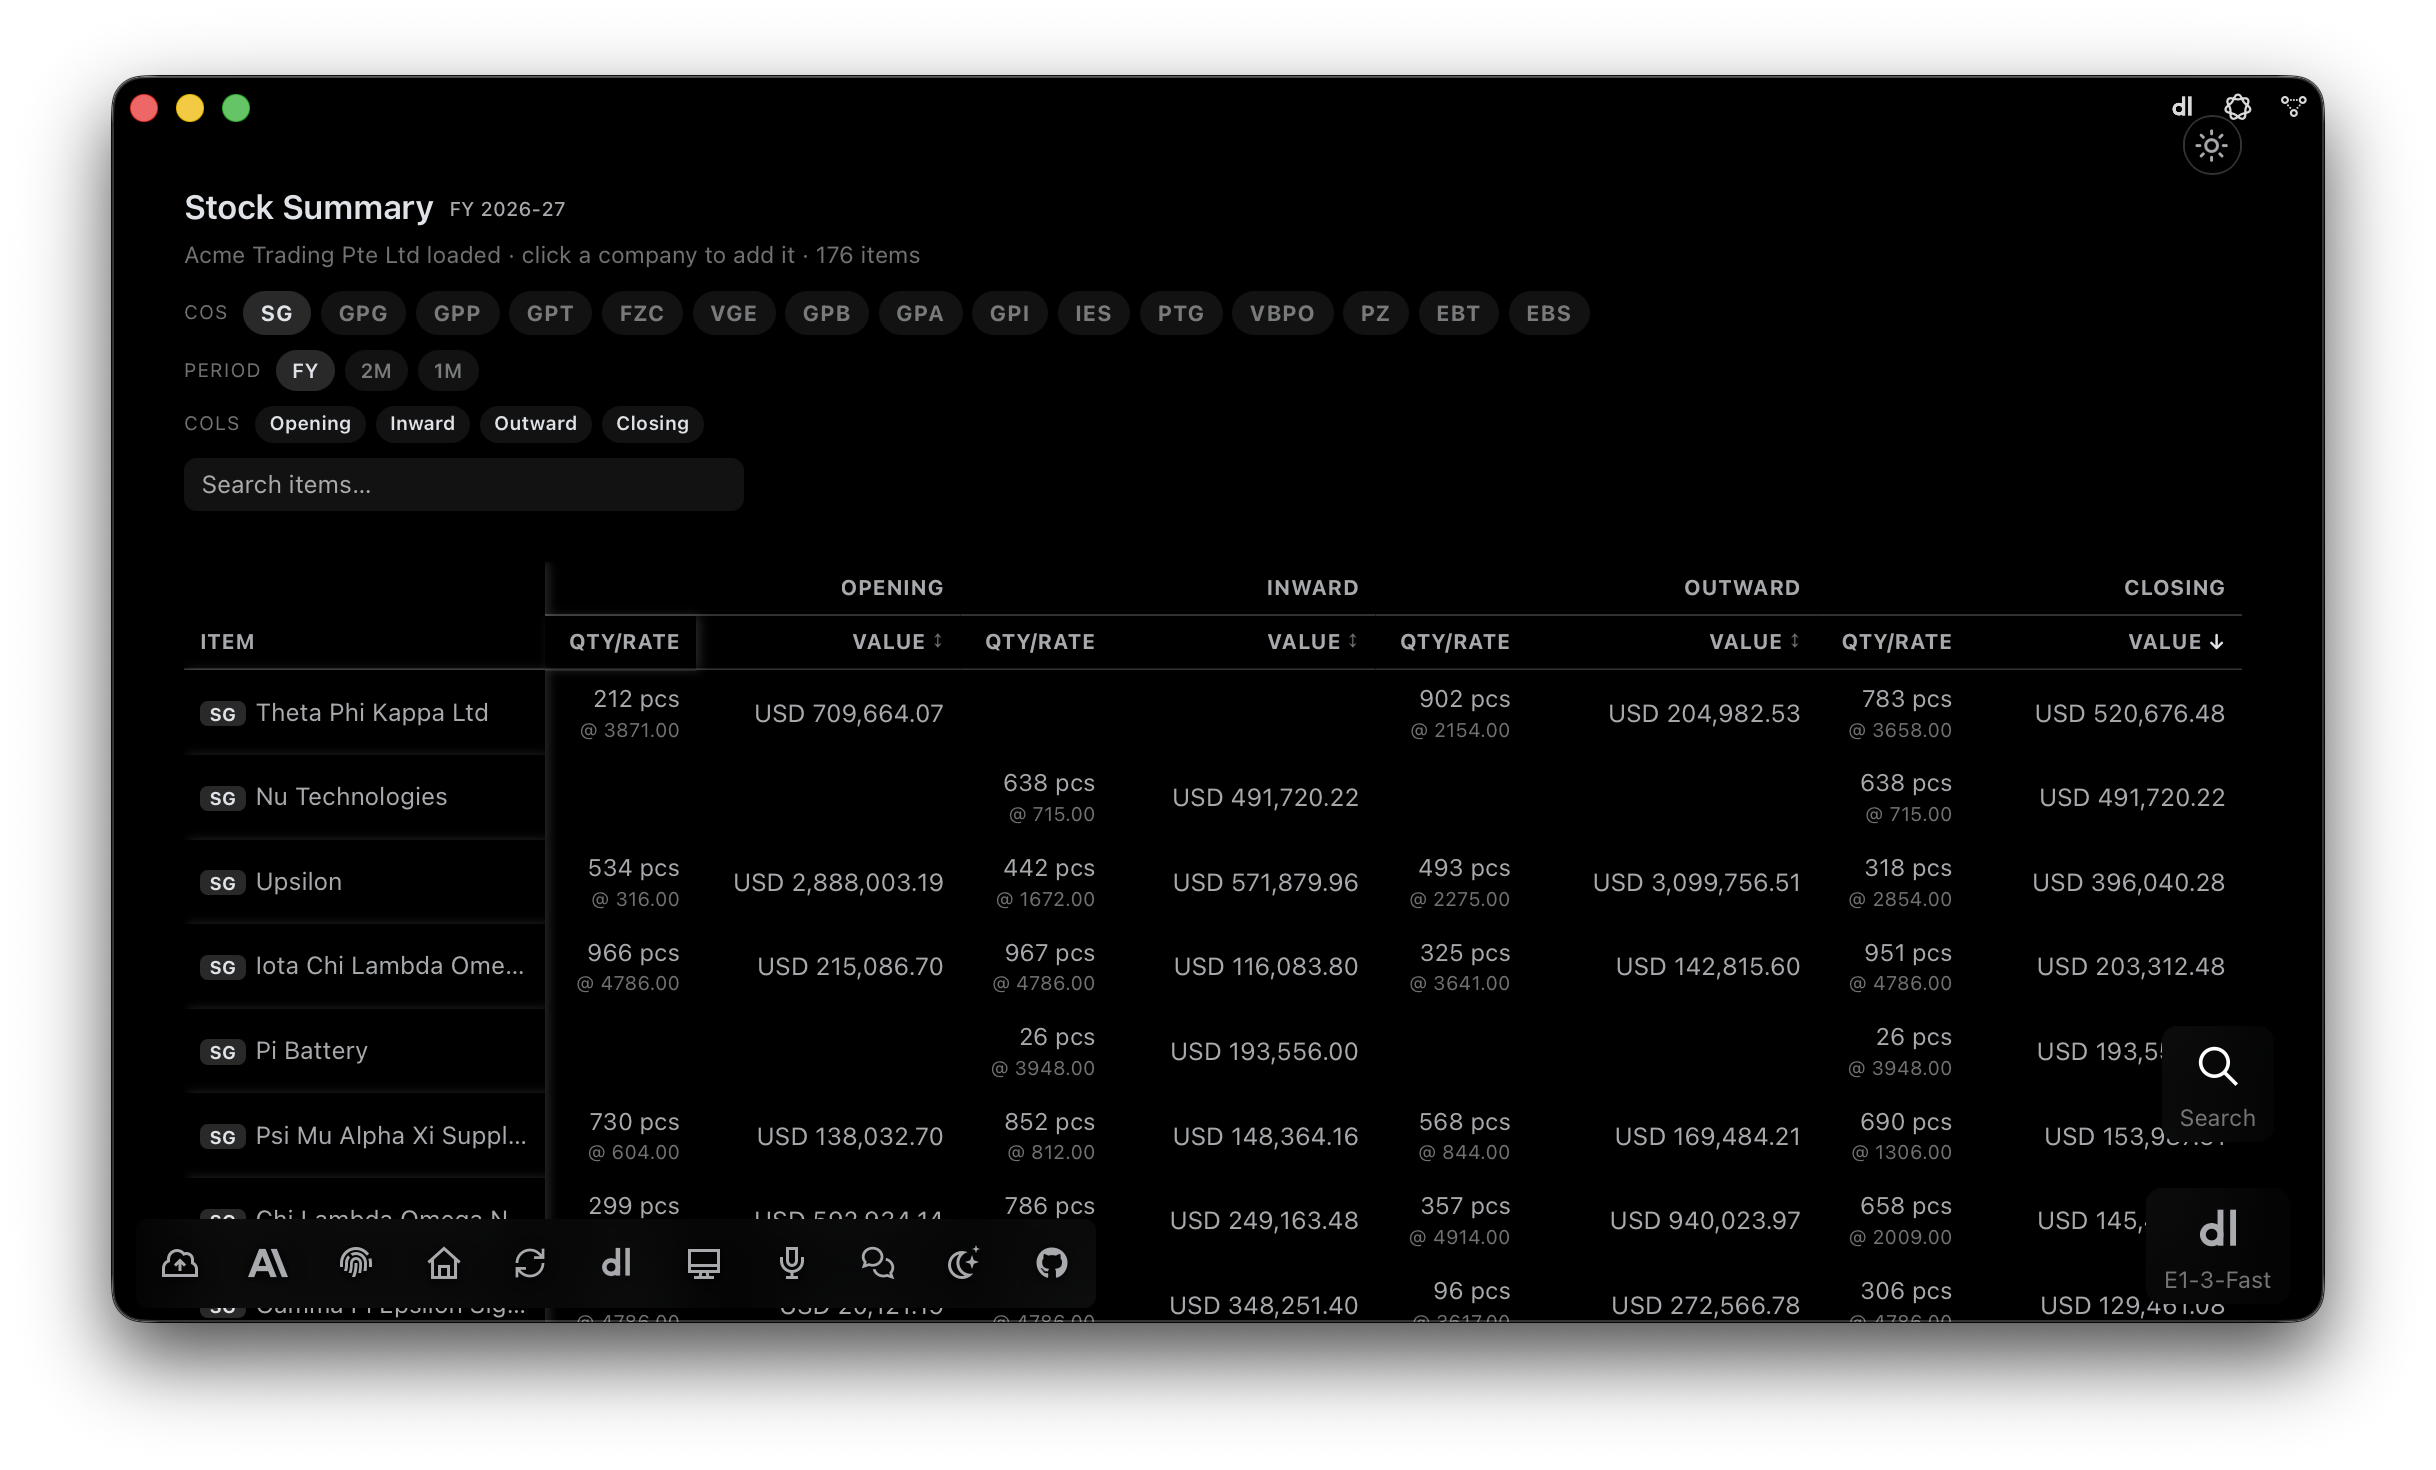
What is in the warehouse and what it is worth. Opening, inward, outward and closing — quantity, rate and value per item — for one company or fifteen at once. Tap a company code to add it to the frame, switch the period, hide the columns you do not need, search any item.
Stock summary for FY 2026-27, all companies.
How many ESC 200 do we have, and where?
What you will see
- Company chips. Add or remove a company from the frame in one tap; totals recompute live.
- Column toggles. Quantity only, value only, or the full opening-to-closing set.
- Valuation on request. Ask for FIFO, weighted average or several methods in one comparative table.
06Bills Receivable
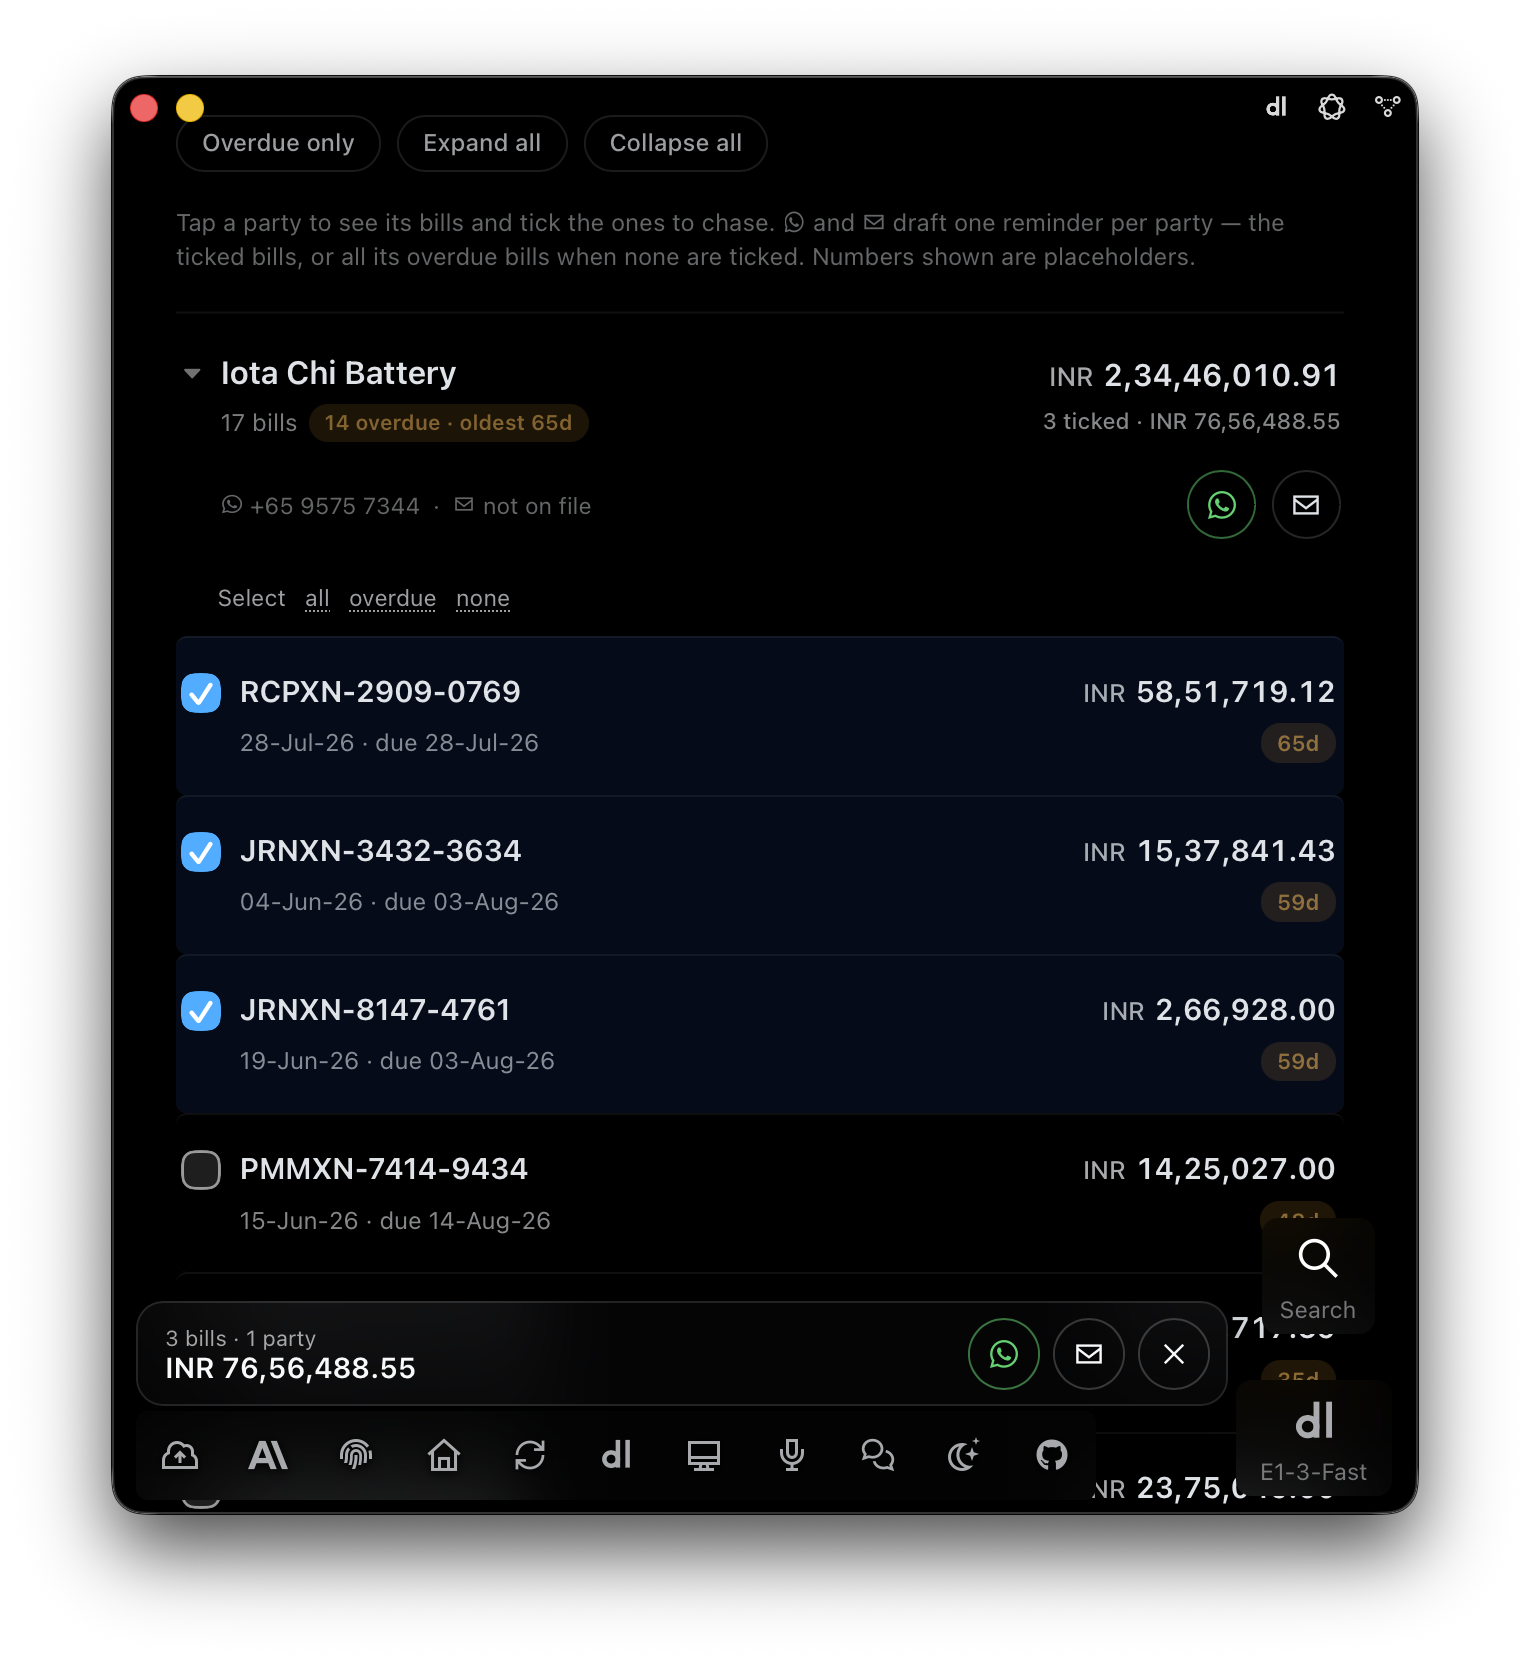
Who owes us money right now — every customer with its open bills, how many are overdue and how old the oldest is. This is the report built to be acted on: tick the bills to follow up and E1pi drafts one reminder per party, on WhatsApp or email, from the contacts already on file. You review, then send.
Who owes us money right now?
Receivables overdue more than 90 days, with reminders.
What you will see
- Ageing on the party line. “61 overdue · oldest 153d” before you open anything.
- One reminder per party. The ticked bills, or all overdue bills when none are ticked — drafted, never sent on its own.
- Overdue only. One filter hides everything that is not yet due.
Reminders open in a compose sheet with the message and the bills listed. Nothing leaves until you press Send.
07Bills Payable
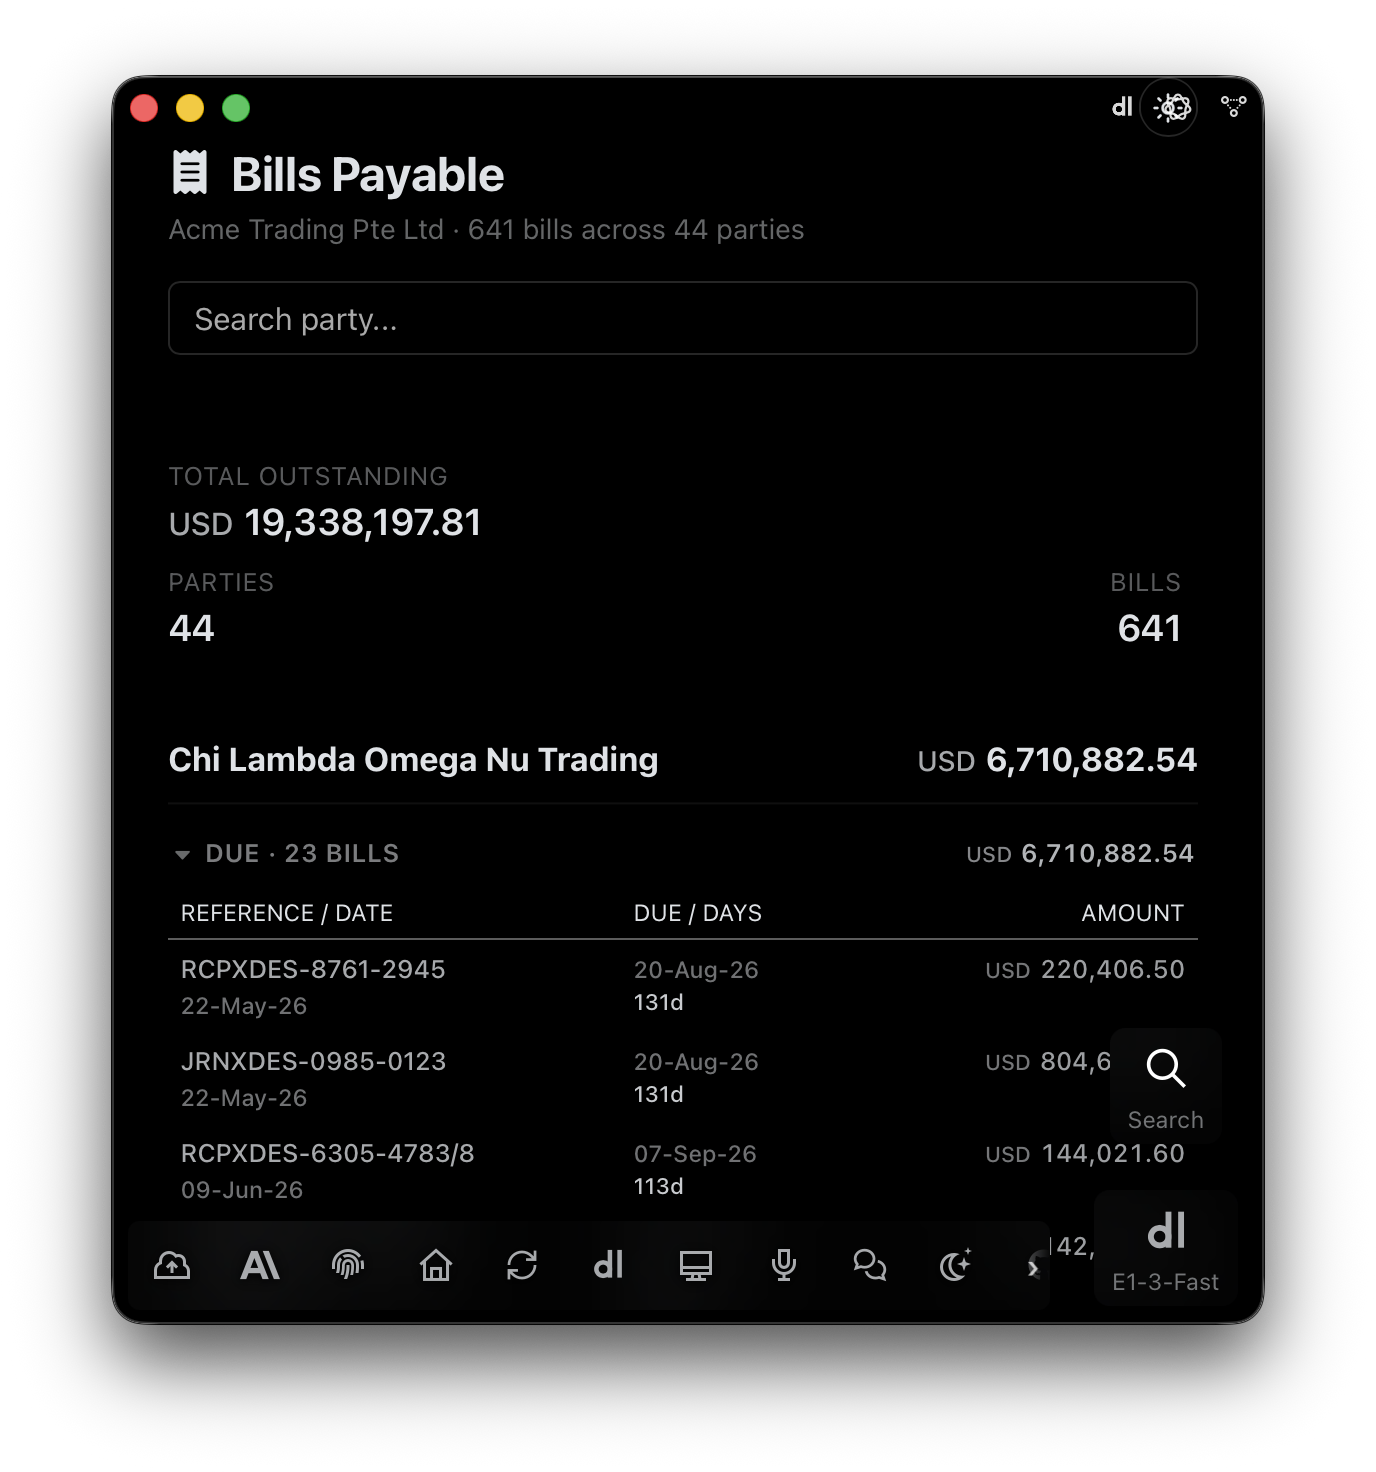
Whom we owe, by due date. Total outstanding across all suppliers, the number of parties and bills, then each supplier’s due bills — reference, bill date, due date, days overdue and amount — so you know exactly what to pay next. Payment advice is one tap away, and it waits for your approval like everything else.
Bills payable, due this week.
Prepare payment advice for everything overdue at Acme Logistics.
What you will see
- Payment advice PDF. Select bills, pick the bank, and the advice is drafted on your letterhead for approval.
- Checked before it is paid. Say “run the checklist on these bills” — quote, route distance, vehicle capacity, supplier GST — before the advice is drafted.
- Approval routed. Above the value you set, the advice goes to the approvers in order, on Teams or the app.
08Sales Report
Every invoice, every customer, every month — the full outward register in one workbook. Invoice number and date, customer, items, quantities, values, taxes, shipping references and payment terms, one row per invoice. Ask for a month and you get one workbook; ask for a year and you get one per month, generated in sequence.
Sales report for August 2026.
Sales header report for the whole of 2025.
What you will see
- Forty columns, one row per invoice. The register your accounts team used to build by hand at month end.
- Preview in the browser, download the workbook. The same data, both ways.
- Month, year or any range. The period is read from your sentence.
09Purchase Report
Every bill, every supplier, every shipment — the inward register with the shipping side reconciled. Beyond the supplier invoice, E1pi reads the document set for each purchase order: bill of lading, arrival date, weights and CBM, goods receipt, bill of entry, permit number and value. Forty-five columns, filled from the documents rather than typed.
Purchase report for July 2026.
What you will see
- Shipping documents read, not retyped. BL number, ETA, gross weight, CBM and permit details lifted from the PDFs.
- Invoice against order. Differences between the supplier invoice and the PO are marked on the row.
- Workbook plus preview. Data-aware formatting: numbers, dates and currencies land in the right format.
10GST / Tax Report
What is due, what is filed, what is pending — a per-document tax register. Each row carries the permit block, the invoice block and the official exchange rate on that document’s date, pulled from the authority’s own published table, so the local-currency figures are the ones the return will accept.
GST report for the quarter ending September.
What you will see
- Official rate on every row. The exchange rate for the invoice date, from the authority’s table — never a monthly average.
- Filing waits for a signature. The return is prepared; a named person approves before anything is filed.
- Current rules. Rates and rules come from the 0-day model, updated as notifications are published.
The columns follow the return format for your jurisdiction; the same sentence produces the right register in Singapore or in India.
11Sales Expense with GP
The true gross profit of every single sale. Freight, insurance, customs, transport, warehouse, commission — each expense allocated to the invoice it belongs to, so a deal that looked profitable at the quote is measured again after every bill has landed. Owners use it to find the customers, routes and products that quietly lose money.
Generate sales expense report for August, with GP per invoice.
What you will see
- GP before and after expenses. Two margins on every invoice; the gap is the lesson.
- Expense by head. Which cost ate the margin — freight, D&D, warehouse — per invoice and per month.
- Drill to the bill. Every allocated expense links to the vendor bill it came from.
12Vendor Report
Where the money goes. Spend by vendor across periods, with the contracts, agreed rates and volumes in the same view — so a rate creep, a duplicate bill or a vendor who is quietly becoming your largest supplier is seen in the report, not in the audit.
Vendor spend for the last twelve months, top twenty.
What you will see
- Spend per vendor, per period. Months or years across; the trend is in the row.
- Against the contract. Agreed rate beside billed rate, with the volume that was actually moved.
- Drill to the bills. Every figure opens into the vendor’s bills for that period, each with its document attached.
—Controls on every report
Whichever report is on screen, the same handful of controls sits with it. Learn them once.
- Company chips. Tap a code to add or remove a company. Two entities or fifteen — one frame.
- Period. Month, quarter, financial year, custom range, or N periods side by side.
- Currency. Read each company in its own currency, or convert all into one.
- Search. Filter ledgers, items or parties as you type. Always bottom-right.
- Expand / collapse. Summary first; open a head to see its ledgers, then its vouchers.
- Export. Sales, purchase and GST registers download as workbooks; payment advice and packing plans as PDFs on your letterhead.
And one thing to remember: asking is the interface. If a report is missing a column you care about, say so — add days overdue, group by state, hide zero rows — and the same report reshapes to the question.